
- Published on
AirBnB Summer Rental Analysis - Minnesota 2023
- Author
- Name
- Jiannina Pinto


Business/Problem Statement:
An aspiring Airbnb host is on the lookout for investment prospects in seasonal rental properties across diverse counties in Minnesota, focusing on the vibrant summer market spanning from June 23 to September 23. To ensure well-informed decision-making, the host is in pursuit of crucial insights into room type profitability, county-specific price dynamics, and pricing strategies based on guest behavior.
Host's Objective
The ultimate goal is to optimize property location and pricing strategies, maximizing revenue while ensuring an exceptional experience for Airbnb guests throughout the bustling summer months in Minnesota. By leveraging data-driven insights and visualizations, the host aims to make strategic investments aligned with market demands, ensuring profitability and guest satisfaction.
Key Questions from the Host
Room Type Profitability:
- What are the most popular room types during the summer season in the Twin Cities?
- What are the average prices of these popular room types?
County-wise Price Variations:
- What are the average rental prices across different counties?
- Are there counties witnessing significant price disparities?
Pricing Strategy:
- How do daily rental rates impact revenue?
- Are there patterns in guest behavior that can inform dynamic pricing strategies?
Data Preprocessing
- Data Collection: Utilized datasets from Inside Airbnb, specifically for the Twin Cities, MN.
- Data Transformation: Integrated data from multiple datasets, uniting them through common identifiers, resulting in a unified and insightful dataset.
- Data Cleaning: Removed duplicates, handled missing values, and standardized data formats for comprehensive analysis using Python.
Visualization Focus
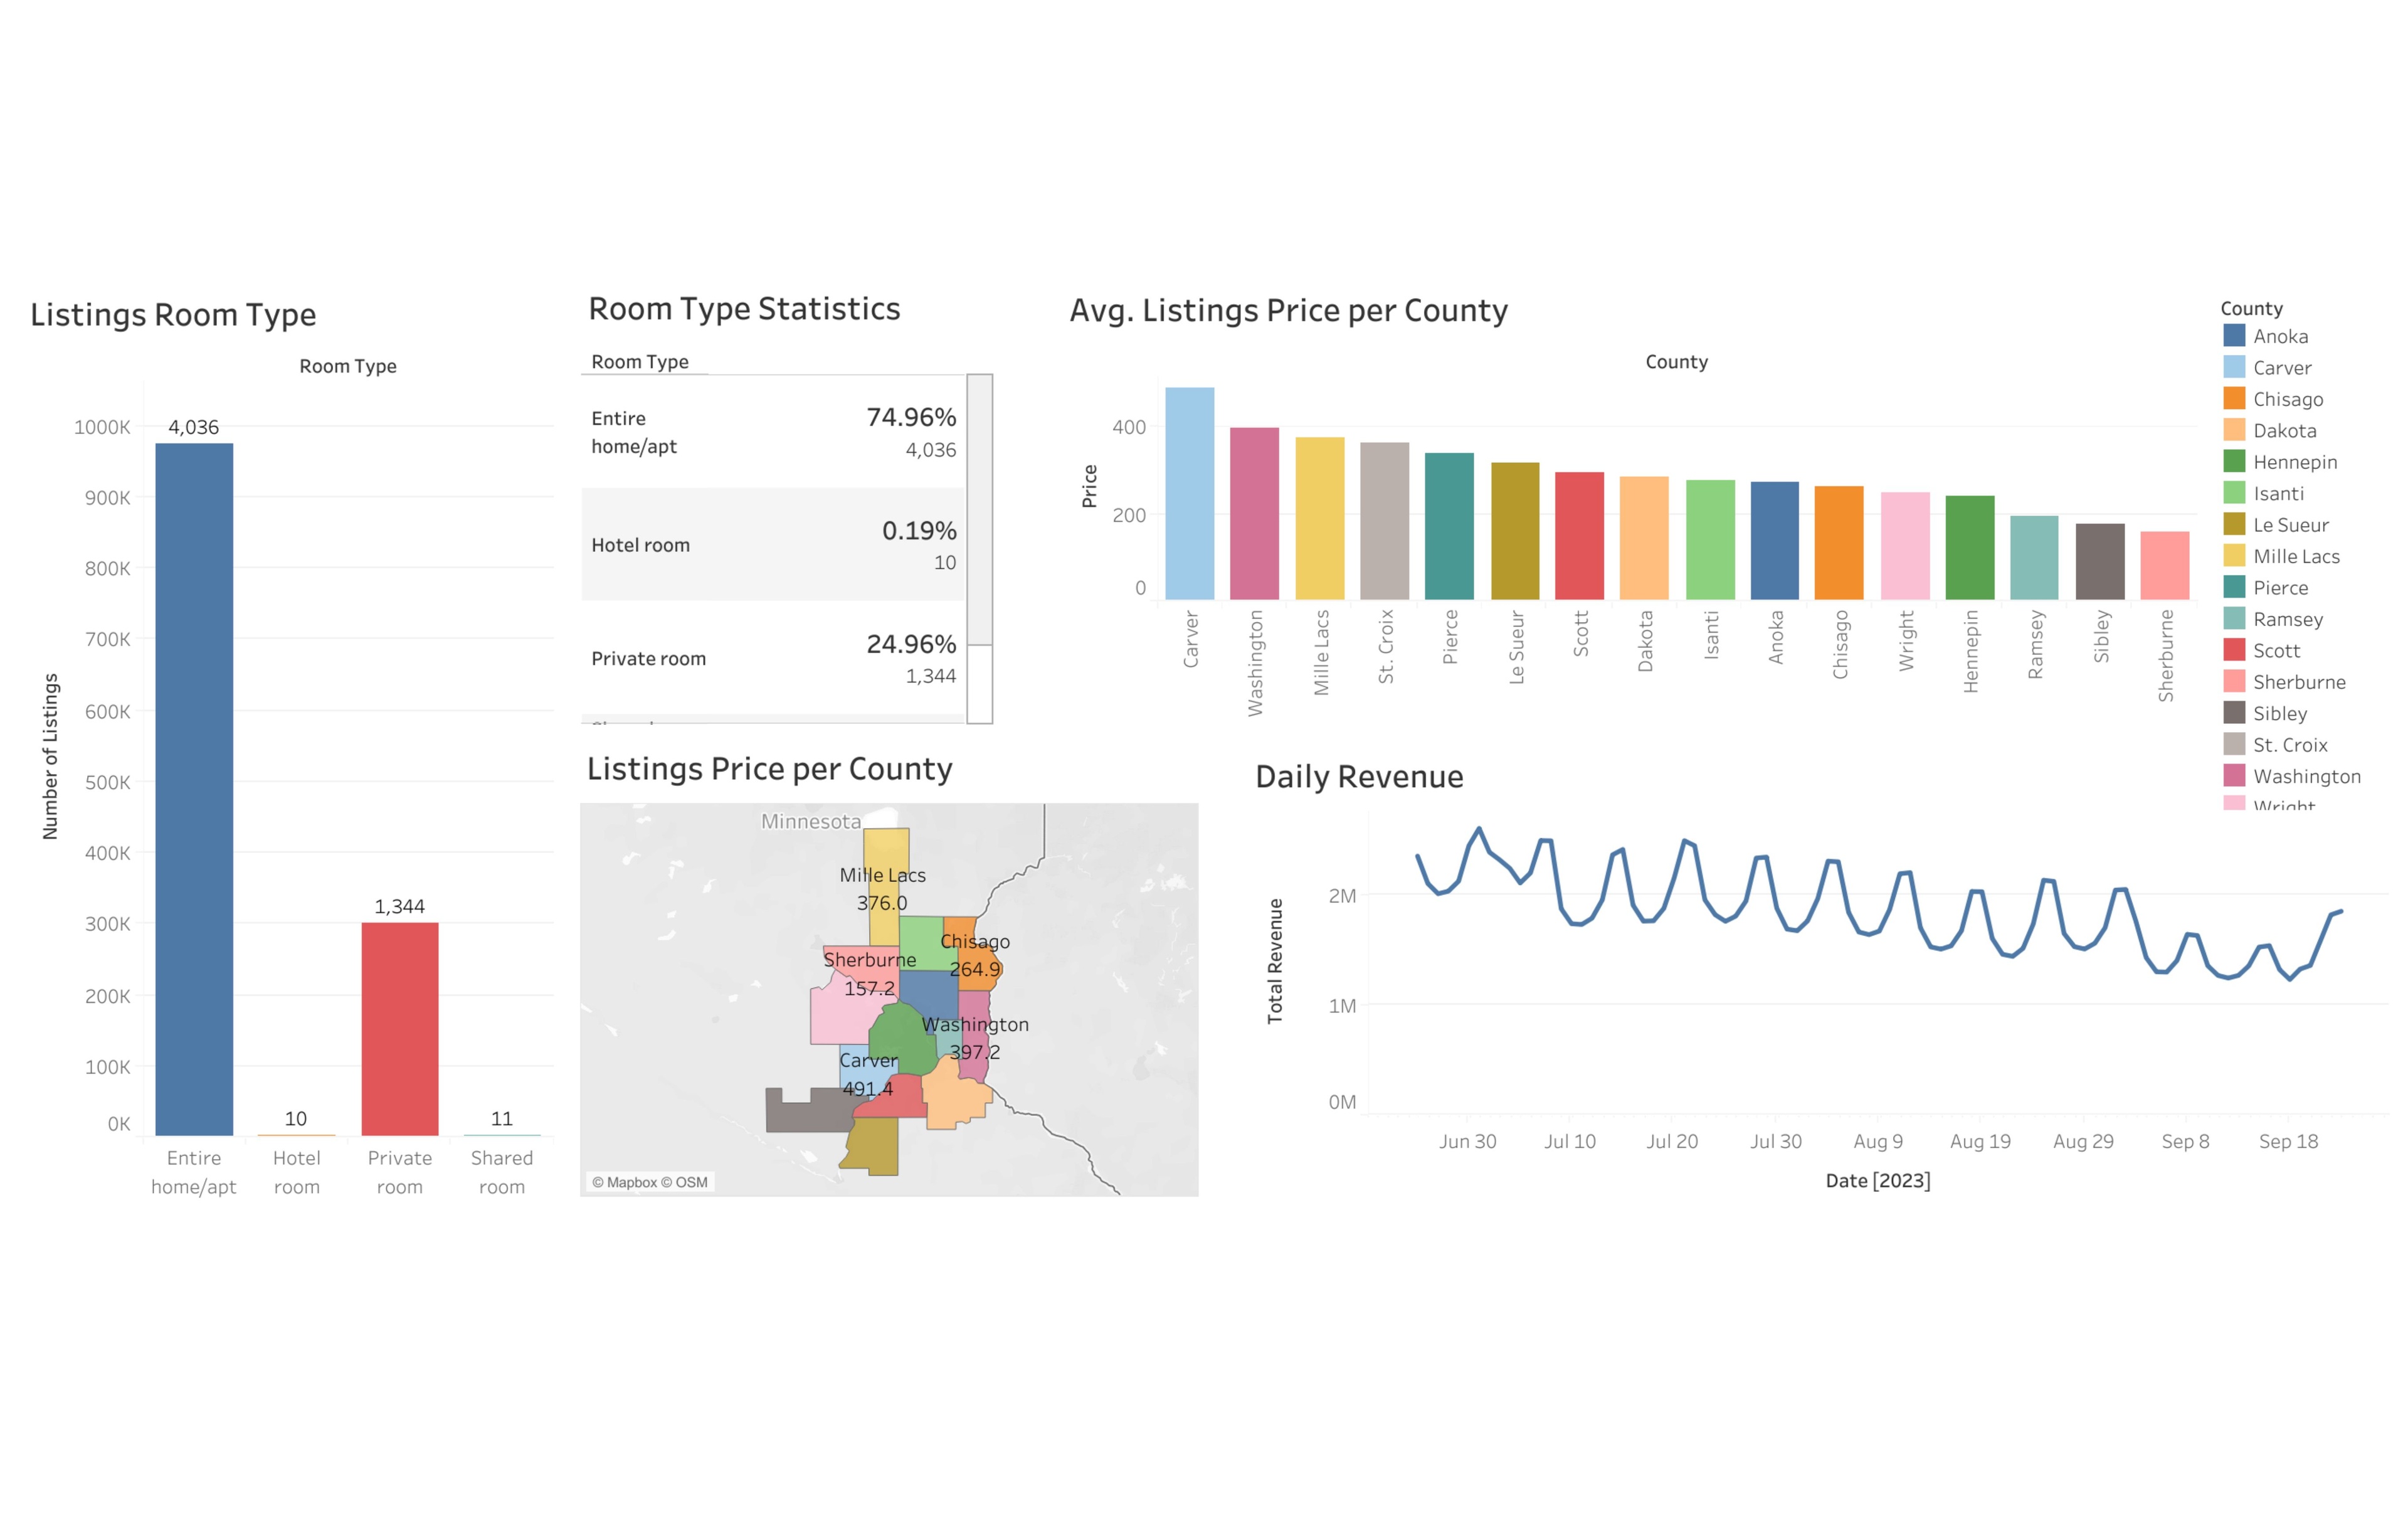
Room Type Distribution: Detailed breakdown of room type distribution and statistics, spotlighting the most favored room types across the Twin Cities.
- Visualization: Bar chart displaying the count of each room type.
County-wise Average Prices: Presented through a visually engaging map and bar chart, illustrating the average rental prices for each county.
- Visualization: Choropleth map and bar chart representing average rental prices by county.
Daily Revenue Patterns: Analysis of daily revenue patterns to discern peak booking periods and optimize pricing during high-demand days.
- Visualization: Line chart showing daily revenue trends throughout the summer season.
Data Insights
-
The room types that most stand out in the Twin Cities are entire home/apartment and private rooms, while hotel rooms and shared spaces appear less preferred according to the dataset.
-
Average pricing stands at $297 for the entire home/apartment and $110 for private rooms, reflecting the prevailing market rates.
-
Across counties, the average rental prices follow a hierarchy, ranging from highest to lowest:
- Carver: $491.4
- Washington: $397.2
- Mille Lacs: $376.0
- St. Croix: $ 362.6
- Pierce: $337.9
- LeSueur: $316.6
- Scott: $295.3
- Dakota: $284.8
- Isanti: $276.4
- Anoka: $ 276.0
- Chisago: $264.9
- Wright: $ 250.5
- Hennepin: $242.2
- Ramsey: $195.7
- Sibley: $177.7
- Sherburne: $157.2
-
Notably, weekends exhibit heightened revenue compared to weekdays during the summer, indicating a significant trend.
Visualizations - Tableau Dashboard
Feel free to explore the intricacies of Airbnb dynamics in the Twin Cities through this detailed Tableau data visualization dashboard.